Introduction
Developed by Welles
Wilder, creator of RSI and DMI, the Parabolic SAR sets trailing price stops for
long or short positions. Also referred to as the stop-and-reversal indicator
(SAR stands for "stop and reversal"), Parabolic SAR is more popular
for setting stops than for establishing direction or trend. Wilder recommended
establishing the trend first, and then trading with Parabolic SAR in the
direction of the trend. If the trend is up, buy when the indicator moves below
the price. If the trend is down, sell when the indicator moves above the price.
Calculation
The formula is quite
complex and beyond the scope of this definition, but interpretation is
relatively straightforward. The dotted lines below the price establish the
trailing stop for a long position and the lines above establish the trailing
stop for a short position. At the beginning of the move, the Parabolic SAR will
provide a greater cushion between the price and the trailing stop. As the move
gets underway, the distance between the price and the indicator will shrink,
thus making for a tighter stop-loss as the price moves in a favorable
direction.
There are two
variables: the step and the maximum step. The higher the step is set, the more
sensitive the indicator will be to price changes. If the step is set too high,
the indicator will fluctuate above and below the price too often, making
interpretation difficult. The maximum step controls the adjustment of the SAR
as the price moves. The lower the maximum step is set, the further the trailing
stop will be from the price. Wilder recommends setting the step at .02 and the
maximum step at .20.
Example

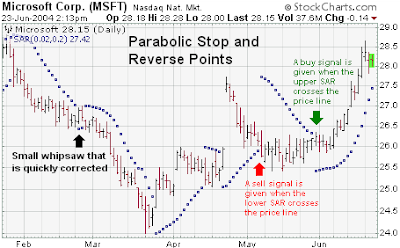
The chart for
Microsoft (MSFT) shows how the Parabolic SAR can catch most trends and allow
the trader to profit from the buy/sell signals. The default settings that
Wilder recommends diminishes distracting fluctuations, but does not make the
indicator immune to whipsaws (black arrow). A proper interpretation of this
indicator would suggest that a trader should close long positions when the
price falls below the SAR (red arrow) and close short positions when the price
rises above the SAR (green arrow).
The Parabolic SAR
works best during strong trending periods, which Wilder himself estimates occur
roughly 30% of the time. Therefore, the user may first want to determine if the
market is trending by using other indicators such as Wilder's ADX line.
Parabolic
SAR and SharpCharts

